使用神经网络提取PDF表格工具来了,支持图片,关键是能白嫖谷歌GPU资源
贾浩楠 发自 凹非寺
量子位 报道 | 公众号 QbitAI
“表哥表姐”们还在为大量PDF文件中的表格发愁吗?
百度一下,网上有大量提取PDF表格的工具,但是,它们都只支持文本格式PDF。
但扫描生成的图片表格怎么办?
别着急,一种使用深度神经网络识别提取表格的开源工具可以帮助你。
兼容图片、高准确率、还不占用本地运算资源,如此实用的工具值得你拥有。
测试实例
如果在输入的PDF文件中检测的表格,模型会在边界框(bounding box)标出表格边框:

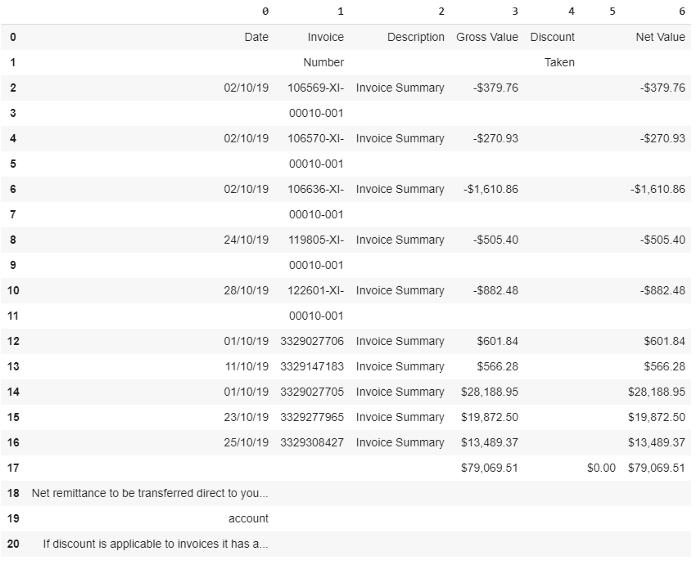
然后,表格数据会被转化为Panda数据框架,方便后续处理:
怎么样,是不是很实用?那这个工具如何使用呢?
使用姿势详解
神经网络算法,还不占用本地运算资源?
对,你没听错,这个工具的所有代码都可以在谷歌Colab上运行。也就是说你可以利用Colab云端资源完成训练和推理,无需本地安装。
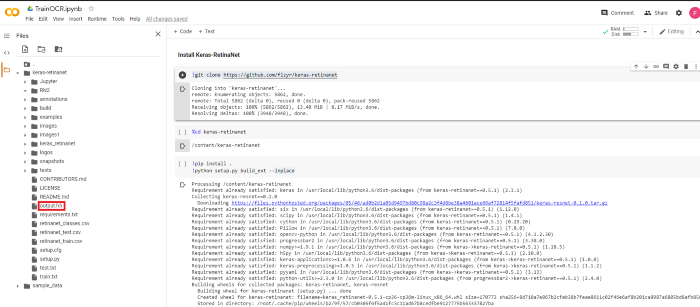
这个工具使用到的深度神经网络是Keras-RetinaNet,首先要在Colab上安装Keras-RetinaNet,通过一下一行代码就可以完成:
git clone https://github.com/fizyr/keras-retinanet同时需要安装必要的库:
pip install .python setup.py build_ext — inplace
训练Keras-RetinaNet识别表格
首先要构建或一个训练使用的数据库。
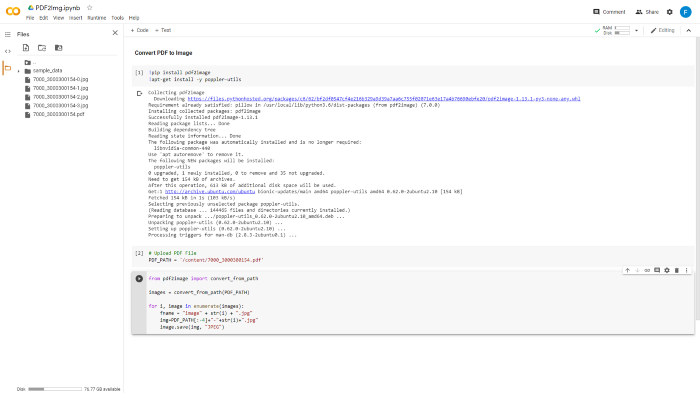
这里要用到Colab工具PDF2Img,将PDF文件转为JPG格式供算法学习。
然后将转好的图片保存在Images文件夹中。接下来需要手动给这些训练数据打标签,这里推荐使用在线标记工具makesense.ai。

将XML注释文件保存在注释文件夹中,并创建用于培训和测试的PDF文件列表,将该列表导入train.txt和test.txt中。

接下来,克隆Github项目https://github.com/ferrygun/PDFTableExtract,并安装beautifulsoup。
运行以下命令以将PASCALVOC格式转换为Keras-RetinaNet所需的格式:
python build_logos.py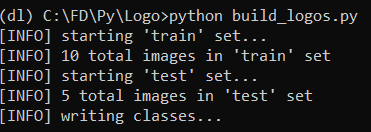
运行上述命令后,会得到retinanet_classes.csv,retinanet_test.csv和retinanet_train.csv。
在retinanet_classses.csv中,由于只识别PDF文档中的表,所以只有到一个class,即class 0。
如果你在打标签的过程中加入页眉页脚等标签,相应能得到多个class。
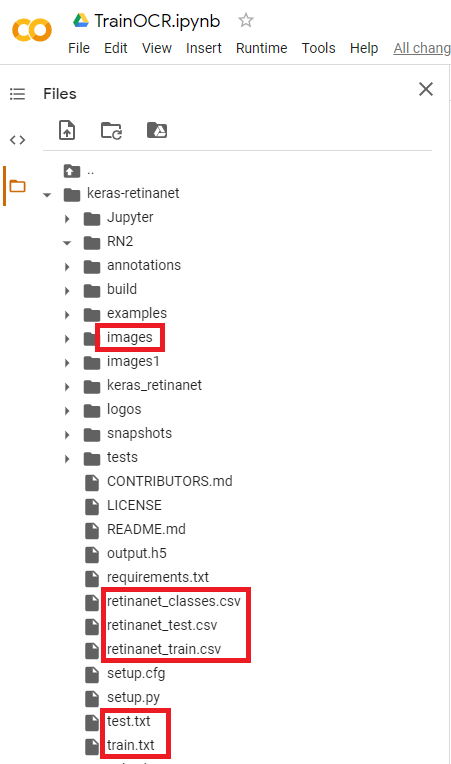
完整的文件和文件夹结构的列表:

然后,将retinanet_classes.csv,retinanet_test.csv,retinanet_train.csv,train.txt和test.txt 导入keras-retinanet的根文件夹中:
接下来,运行Colab TrainOCR,可以根据要训练的JPG文件数量来调整训练的epoch数量。
训练完成后,就会得到权重文件output.h5,下载此文件并将其保存到本地主机。后面将使用该文件来运行测试。
这里需要注意的一点是,在Colab中,已将文件上传到Git并进行了Git克隆。
运行测试
运行测试前,还需要安装处理PDF文件必要的库。
PyPDF2是一个python工具库,能够提取文档信息,裁剪页面等。
使用以下命令安装此库:
pip install PyPDF2Camelot是专门用于解析PDF页面表格的python库。
使用以下命令安装此库:
pip install camelot-py[cv]PDF2IMG是将Python转换为PIL Image对象的python库。
使用以下命令安装此库:
pip install pdf2imag在运行预测之前,需要使用从训练中获得的权重文件output.h5加载模型,并从retinanet_classes.csv定义标签class 0。
model_path = ‘output.h5’model = models.load_model(model_path, backbone_name=’resnet50’)labels = ‘retinanet_classes.csv’LABELS = open(labels).read().strip().split(‘\n’)LABELS = {int(L.split(‘,’)[1]): L.split(‘,’)[0] for L in LABELS}print(LABELS){0: ‘tabel’}
接下来运行测试
import numpy as npimport cv2import matplotlib.pyplot as pltimage_path = imgfname#image = cv2.imread(image_path)image = read_image_bgr(image_path)image = cv2.cvtColor(image, cv2.COLOR_BGR2RGB)output = image.copy()output = cv2.cvtColor(output, cv2.COLOR_BGR2RGB)print(output.shape) # row (height) x column (width) x color (3)image = preprocess_image(image)(image, scale) = resize_image(image)image = np.expand_dims(image, axis=0)# detect objects in the input image and correct for the image scale(boxes, scores, labels) = model.predict_on_batch(image)boxes /= scaleconfidence = 0.2from google.colab.patches import cv2_imshowimport matplotlib.pyplot as pltlabel_out = []result = ""# loop over the detectionsfor (box, score, label) in zip(boxes[0], scores[0], labels[0]):# filter out weak detectionsif score < confidence:continue# convert the bounding box coordinates from floats to integersbox = box.astype("int")# build the label and draw the label + bounding box on the output# imagelabeli = labellabel = "{}: {:.2f}".format(LABELS[label], score)print(label)if LABELS[labeli] not in label_out:label_out.append(LABELS[labeli])cv2.rectangle(output, (box[0], box[1]), (box[2], box[3]), (255, 0, 0), 12)print(box[0])print(box[1])print(box[2])print(box[3])#resultcv2.putText(output, label, (box[0], box[1] - 10), cv2.FONT_HERSHEY_SIMPLEX, 4.5, (255, 1, 1), 12)plt.figure(figsize=(20, 20))plt.imshow(output)plt.show()
如果检测的表格,模型会在边界框(bounding box)标出表格边框:
边界框坐标(x1,y1,x2,y2),将table_area输入到Camelot read_pdf函数中,table_area是已标准化的边界框。
interesting_areas=[]output = [[x1, y1, x2, y2]]for x in output:[x1, y1, x2, y2] = bboxes_pdf(img, pdf_page, x)bbox_camelot = [",".join([str(x1), str(y1), str(x2), str(y2)])][0] # x1,y1,x2,y2 where (x1, y1) -> left-top and (x2, y2) -> right-bottom in PDF coordinate space#print(bbox_camelot)interesting_areas.append(bbox_camelot)print(interesting_areas)output_camelot = camelot.read_pdf(filepath=pdf_file, pages=str(pg), flavor="stream", table_areas=interesting_areas)output_camelot[0].df
这样就可以将表格数据转化为Panda数据框架,方便后续处理:
图片怎么办
针对扫描图片格式的PDF表格,可以使用Ocrmypdf包来将图片格式PDF转为文本格式。
Ocrmypdf是一个python软件包,可将基于图像的pdf转换为基于文本的PDF。
安装ocrmypdf,可以通过以下命令行将其用于macOS和Linux:
brew install ocrmypdf通过以下命令调用:
ocrmypdf input_file.pdf output_file.pdf之后就可以按照上面的方法进行表格提取了。
怎么样,这款兼容图片,又能白嫖谷歌GPU的PDF表格工具对你有帮助吗?
传送门
项目地址:
https://github.com/ferrygun/PDFTableExtract
在线打标签工具:
https://www.makesense.ai/
— 完 —
本文系网易新闻•网易号特色内容激励计划签约账号【量子位】原创内容,未经账号授权,禁止随意转载。
每天5分钟,抓住行业发展机遇
如何关注、学习、用好人工智能?
每个工作日,量子位AI内参精选全球科技和研究最新动态,汇总新技术、新产品和新应用,梳理当日最热行业趋势和政策,搜索有价值的论文、教程、研究等。
同时,AI内参群为大家提供了交流和分享的平台,更好地满足大家获取AI资讯、学习AI技术的需求。扫码即可订阅:

加入AI社群,与优秀的人交流

量子位 QbitAI · 头条号签约作者
վ'ᴗ' ի 追踪AI技术和产品新动态
喜欢就点「在看」吧 !
关注公众号:拾黑(shiheibook)了解更多
[广告]赞助链接:
四季很好,只要有你,文娱排行榜:https://www.yaopaiming.com/
让资讯触达的更精准有趣:https://www.0xu.cn/
![玛卡呆卡揣着内存不足的手机回家啦 想先看哪个[二哈] ](https://imgs.knowsafe.com:8087/img/aideep/2022/12/11/3710eec925b46287943a57fc38f0c8a6.jpg?w=250)


 量子位
量子位
 关注网络尖刀微信公众号
随时掌握互联网精彩


- 1 总书记的8次座谈和8次调研 4901331
- 2 下一个被淘汰的电子产品是什么 4973733
- 3 重庆多地禁办“无事酒”背后 4892812
- 4 让古建老宅活起来 4741572
- 5 余承东把问界M9送到360楼下 4632959
- 6 00后小伙约嫖60后大妈被抓 4534540
- 7 神十八点火瞬间航天员齐刷刷敬礼 4465493
- 8 兔兔被抓起强吻吓得嗷嗷大叫 4374635
- 9 女生被造黄谣跳楼身亡?不实 4218185
- 10 学位法通过 4172336